Designing guide RNA (gRNA) to create a double-strand breaks (DSB) at a specific genomic location can seem straightforward (simply look for a PAM site) but there are many factors to consider for ensuring that the genome editing occurs at the desired locus while avoiding off-target effects.
We developed the Edit-R algorithm with functionality and specificity in mind to enable successful genome editing. When gRNA are not specific or functional they can lead to unwanted gene expression and unwanted cellular effects. Specificity refers to how well the gRNA can target a particular gene, while functionality refers to the ability of the gRNA to effectively turn the gene on or off.
The Edit-R algorithm with specificity assessment is used to score each gRNA and offer pre-designed gRNAs with the maximum likelihood of functional protein knockout and minimal off-target editing. These reagents are available as synthetic and chemically modified RNAs for arrayed screening or as expressed lentiviral products for pooled screening.
A CRISPR Knockout Algorithm for Effective Gene Function Studies
While CRISPR-Cas9 can be a highly effective tool for causing a functional gene knockout to interrogate gene function, early studies demonstrated a significant variability among guide RNA functionality.. High-performing guide sequences must both cut genomic DNA and effectively disrupt a gene through the formation of insertions and deletions (indels) that block translation of the altered mRNA into functional protein. In order to design gRNAs with the highest likelihood of generating functional gene knockout, we developed an algorithm trained on data using functional gene disruption.
Phenotypic data from functional gene knockout
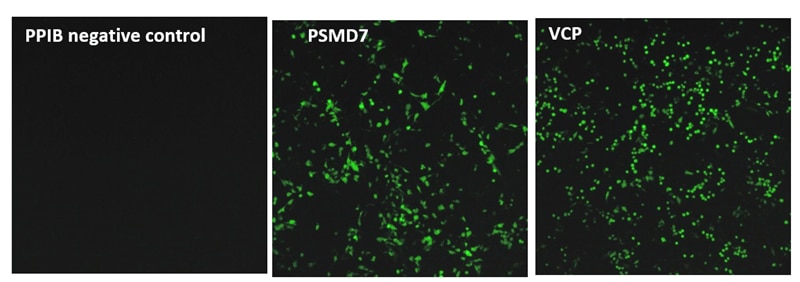
To this end, we tested a wide array of crRNAs against multiple gene targets involved in proteasome function in a recombinant U2OS ubiquitin-EGFP proteasome cell line. This line stably expresses an EGFP reporter fused to an uncleavable mutant human Ubiquitin (Gly76Val) that enables rapid degradation of the EGFP protein, leading to a low EGFP baseline fluorescence. A disruption of proteasome-related components, for instance by small molecule inhibitors, gene inhibition or gene knockout, leads to inhibition of the EGFP degradation and increase of fluorescence signal (Figure 1).
We synthesized all gRNAs (upstream of NGG PAMs) targeting the coding regions of ten genes previously identified as essential for proteasome function to generate >1,100 data points. gRNAs exhibited different levels of EGFP fluorescence, indicating variable levels of functional gene disruption; we used this data for machine learning to identify design characteristics that correlated with successful gene knockout Functional gene disruption depends both on gene position and target sequence composition. Figure 2 is an example of data obtained from targeting the VCP (A) or PSMD8 (B) genes. The VCP gene is large and consists of 17 exons which are color-coded in the graph; it required 266synthetic crRNAs to target the entire length of this gene. The distance from the start site is plotted against the intensity of the EGFP signal with an increase in EGFP signal indicating functional knockout of the VCP gene and protein. crRNAs with high functionality were identified across different exons, including early or late exons. For example, in one early exon (exon 2) there was one highly functional crRNA and mostly less functional crRNAs At exon 14, we see regions where there are many highly functional crRNAs but also nonfunctional or less functional crRNAs adjacent to high functioning crRNAs. This clearly indicates that sequence specific factors contribute to gRNA functionality. The PSMD8 gene (B) consists of 7 exons. Interestingly, we found that gRNAs targeting the first 200 bases of the first exon (exon 1) did not lead to functional gene disruption (no increase of EGFP signal), while they showed high ability for indel formation (data not shown). We found that this gene most likely utilizes an alternative transcriptional start site (TSS), providing a clear demonstration of how selecting gRNAs in an early exon can lead to no functional gene knockout. Around 15% of genes in the FANTOM database have alternative TSS that may lead to skipping of the early exons in the synthesis of the proteins and this must be considered in gRNA design for downstream functional protein analysis.
We used machine learning to analyze the characteristics of the efficient gRNAs and found features that are predictive of sgRNA activity. Some of the features included sequence characteristics (nucleotide position, dinucleotide composition, GC content, Tm of the DNA-RNA complex, PAM sequence, overlapping PAMs and more) as well as target gene characteristics (distance in gene, number of possible start sites, distance from start and stop codons, distance from intron/exon junction, targeting the +/- strand and others). We developed a quantitative model based on these features to optimize gRNA activity prediction and created a tool to use this model for sgRNA design. Performance of the design algorithm was tested by generating ROC (Receiver Operating Characteristic) curves (Fig 3). The Mean Area Under the Curve (AUC) value for our model was 0.78 indicating a high predictive power and a high degree of confidence in guides characterized by this algorithm.
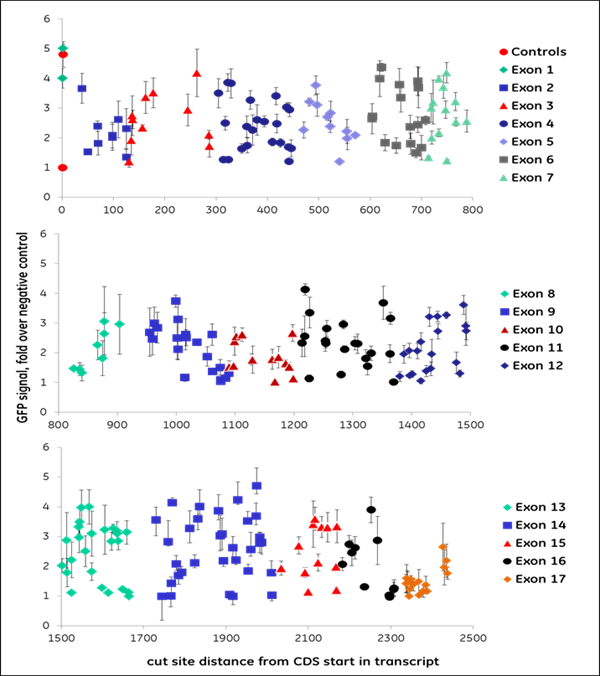
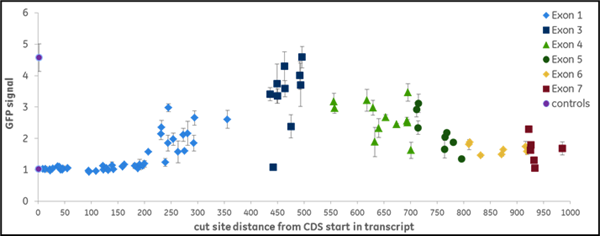
Figure 2. gRNAs vary in their ability to cause functional gene disruption. Recombinant U2OS Ubi[G76V]-EGFP -Cas9 cells were transfected with synthetic crRNA:tracrRNA complexes along the length of the coding regions of the (A) VCP gene or (B) PSMD8 gene. EGFP fluorescence was measured at 72 hours post-transfection, using an Envision plate reader.
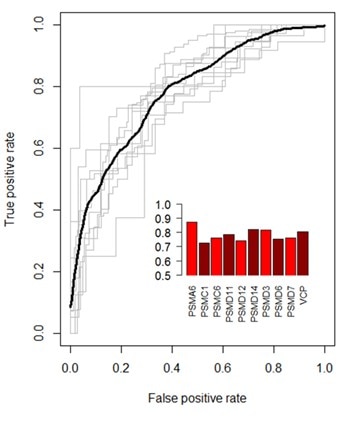 Figure 3. Performance validation of the CRISPR gRNA prediction algorithm. An ROC curve compares the rate of true positives to that of false positives and provides a measure of performance for classification models. The model was trained on all possible combinations of 9 genes and tested individually on the remaining held-out gene. Each gray line indicates the ROC curve for a held-out gene. The black line is the mean ROC curve. The bar graph inset indicates the Area Under the Curve (AUC) for each gene.
We further examined the predictive utility of the CRISPR algorithm outside of a defined cellular pathway (proteasome function) by designing gRNAs against a different set of genes. We picked 10 high- and 10 low-scoring gRNAs, targeting 10 widely-studied genes (based on previous demand for RNAi product orders), and tested them for total indel formation by Next Generation Sequencing (Figure 4). A majority of the high-scoring crRNAs (93%) (blue bars) showed high efficient editing (defined as greater than 40% indel formation), while only 33% of the low-scoring crRNAs (orange bars) had high editing efficiency, demonstrating that gRNAs with high functionality scores overall have higher editing efficiency, measured as indel formation at the DNA level.
Applying the discovered design rules, enables generation of on the shelf-reagents against any gene of interest, as well as improved screening libraries with guaranteed gene knockout ability.
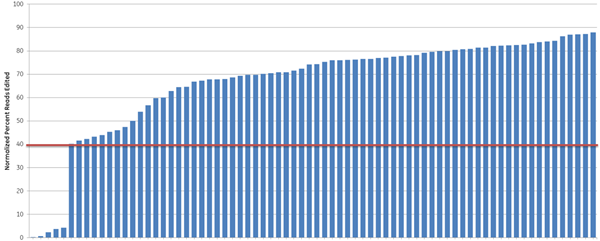
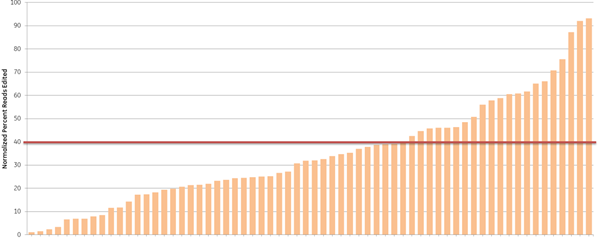
Figure 4. Algorithm scores correlate with editing efficiency (NGS analysis of indel formation). Ten crRNAs with highest algorithm score (blue) and ten crRNAs with lowest algorithm score (orange) targeting 10 genes were transfected in HEK293T cells that stably express Cas9 and assessed for editing by Next Generation Sequencing. The Cas9-HEK293T cell line was transfected with 50 nM crRNA:tracrRNA. Seventy-two hours post-transfection, cells were lysed and Nextera transposon-adapted amplicons spanning each crRNA site were generated for every treated sample as well as for a matched control amplicon from untransfected samples. Samples were indexed using the Nextera 96-well index kit and pooled for sequencing on a MiSeq instrument (paired end reads, 2 x 300 length). Reads that passed NGS quality filtering criteria were aligned to the reference file (Bowtie2 v2.1.0). Percent perfect reads were calculated and normalized to the control untransfected samples (Samtools v0.1.12a); the data is presented as normalized percent edited.
Validating the Edit-R algorithm
To examine the ability of the algorithm-designed gRNAs to predict efficient functional gene knockout on a protein level, tested for correlation of the algorithm scores with effects on target-gene protein level or activity in specific functional assays. We first examined the functionality of 79 gRNAs targeting TNFRSF1A (encoding the soluble portion of TNFRSF1A protein) for their ability to cause a decrease of the TNFRSF1A protein level, as measured by an TNFRSF1A ELISA assay. Figure 5A shows the effect of all crRNAs, arranged by algorithm-predicted functionality scores, on the TNFRSF1A protein level in the cell medium. The crRNAs with high algorithm scores show high functional gene disruption, measured as a decrease at the target gene protein levels. Among the crRNAs with low scores, there is higher variability of the functionality with many guides showing low ability for functional gene knockout (Figure 5A). This is clearly depicted by a box-plot representation of the functionality of crRNAs that is divided in 4 quartiles based on algorithm score, from low to high. The medians, distribution of data between the lower and upper quartile and the minimum and maximum values demonstrate that algorithm designed high-scoring crRNAs demonstrate increase functionality in a protein knockout assay (Figure 5B).
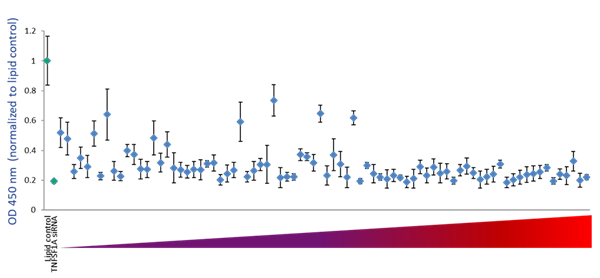
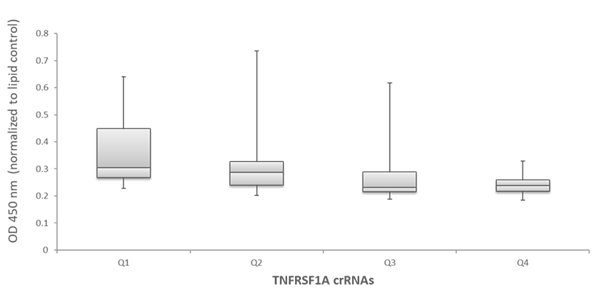
Figure 5 - Examination of functionality of TNFRSF1A crRNAs by ELISA assay for soluble TNFRSF1A
A. U2OS-Proteasome cells with integrated Cas9 (under CAG promoter) were plated in 96-well plates at 10,000 cells per well. 24h after plating, cells were transfected with 50 nM crRNA:tracrRNA using 0.2 µg/well of DF4. siRNA targeting TNFRSF1A was used as a positive control and data was normalized to the negative control (lipid only). Cell medium was collected 72 h after transfection and assayed for soluble TNFRSF1A using Quantikine Human sTNF RI/TNFRSF1A Quantikine ELISA Kit (R&D Systems).
B. Box plot representation of the functionality of the TNFRSF1A crRNAs in the ELISA assay for soluble TNFRSF1A –crRNAs are divided in 4 quartiles based on their algorithm score from low to high (Q1, Q2, Q3 and Q4).
We further evaluated the Dharmacon Edit -R algorithm by examining the correlation of the algorithm predicted functionality scores with target gene knockout through downstream functional effects. We tested all possible crRNAs targeting three genes involved in cell survival, BCL2L1, PLK1 and WEE1, by transfecting them into Cas9 stable cells and measuring apoptosis using an apoptosis assay . Figure 6A is box plot data, with crRNAs divided into bottom half (H1) and top half (H2) boxes based on their algorithm design score. Again, crRNAs with high functional scores show stronger phenotypes than low scoring designs. Finally, mitotic index was used to look at correlation of Edit-R algorithm scores with phenotypic effects of knockout of genes involved in mitotic regulation (PLK11 and KIF11 gene targets), as measured by the percent of cells positive for Phosphorylated Histone H3 (pSer10) (Figure 6B), also indicating that high-scoring crRNAs have increased functionality in the mitotic index assay.
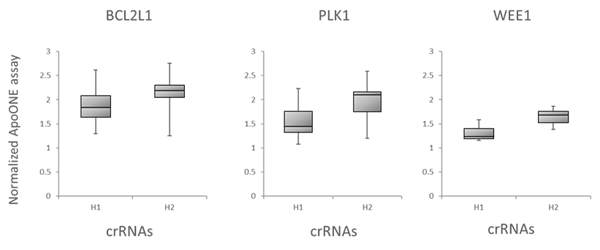
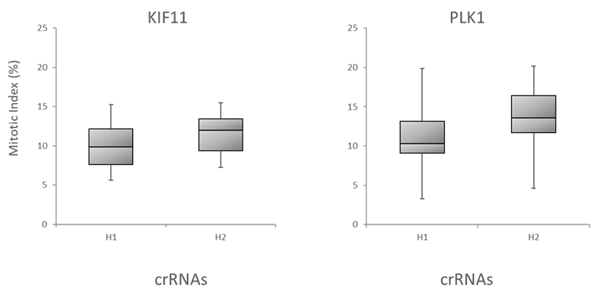
Figure 6. Correlation of the algorithm scores with functional assays
A. Box plot representation of the functionality of crRNAs targeting BCL2L1, PLK1 or WEE1 in an apoptosis assay. U2OS-Proteasome cells with integrated Cas9 (under CAG promoter) were plated in 96-well plates at 10,000 cells per well. 24h after plating, cells were transfected with 25 nM crRNA:tracrRNA using 0.2 µg/well of DF4. Cells were analyzed for apoptosis 48 h after transfection. The crRNAs were divided into bottom half (H1) and top half (H2) based on their algorithm design score.
B. Box plot representation of the functionality of crRNAs targeting KIF11 or PLK1 in mitotic index assay. U2OS-Proteasome cells with integrated Cas9 (under CAG promoter) were plated in 96-well plates at 5,000 cells per well. 24h after plating, cells were transfected with 25 nM crRNA:tracrRNA using 0.1 µg/well of DF4. Cell were fixed 48 h after transfection and analyzed for mitotic index by high content analysis. Briefly, cells were stained with Phospho-Histone H3 pSer10 Antibody and Goat anti-Rabbit Secondary Antibody. Nuclei were stained with Hoechst dye. Mitotic index is presented as % of cells in mitosis (positive Phospho-Histone H3 signal). Note: the mitotic index in untreated controls was at ~ 3%. The data is presented as box plots, with the crRNAs divided into bottom half (H1) and top half (H2) based on their Edit-R functional score.
A Focus on CRISPR-Cas9 Guide RNA Specificity
When selecting guide to knockout a gene using CRISPR-Cas9, efficiency or function of the gRNA is paramount. High-performing guide sequences must both cut genomic DNA and effectively disrupt a gene through the formation of insertions and deletions that block translation of the altered mRNA into functional protein. However, determining a functional guide is only half of the challenge. A highly specific guide is also required for the best gene editing outcome without causing permanent changes at unwanted locations in the genome.
Cas9 uses the first 20 nucleotides of a guide RNA to target a genomic location, by base pairing with perfect or near-perfect complementarity to a sequence in the genome directly upstream of the protospacer-adjacent motif (PAM), which for S. pyogenes Cas9 is NGG. Multiple early studies demonstrated that up to three mismatches (or more!) can be tolerated in rare cases, leading to off-target recognition and cleavage of unintended genomic target sites (Fu, 2013; Hsu, 2013; Pattanayak, 2013). In general, mismatches in the seed region (the ~10 nucleotides closest to the PAM) are less tolerated, and two adjacent mismatches are even less tolerated (Anderson, 2015). However, considering that the haploid human genome consists of more than three billion bases, it is a daunting task to identify all of the possible off-targeting outcomes for one gRNA, let alone multiple gRNAs under consideration for targeting a single gene.

The Dharmacon off-targeting alignment tool searches for all possible off-target positions of each gRNA, including not just mismatched bases, but single base gap alignments (as shown in Figure 1). This is important, since for ranking effective gRNAs by both function and specificity, one cannot be assured of the gRNA choice if the off-targeting search is incomplete.
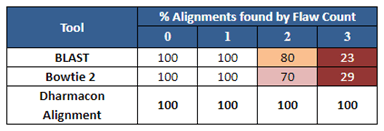
Figure 2 is an example of how the Dharmacon alignment tool performs against some public sequence alignment tools for a particular sequence. Notice that all of the tools identify off-target sequences with one flaw (a flaw is a single mismatch or gap), but for even as few as two or three flaws, the public tools give an incomplete picture of the possible off-targeting outcomes in the genome.
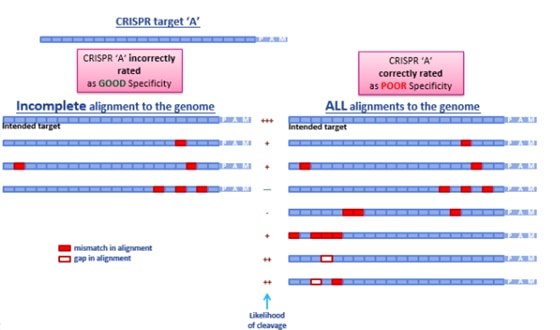
How this incompleteness plays out when searching for off-targets and ranking guide RNAs is demonstrated in Figure 3. Simply by not finding gapped potential off-target alignments, a guide RNA would be incorrectly predicted as having good specificity (on the left), when in reality, several potential off-target candidates exist that have gapped alignments distal to the seed region (on the right). These gapped alignments are highly probable off-targets, rendering this chosen gRNA a poor candidate in terms of specificity.
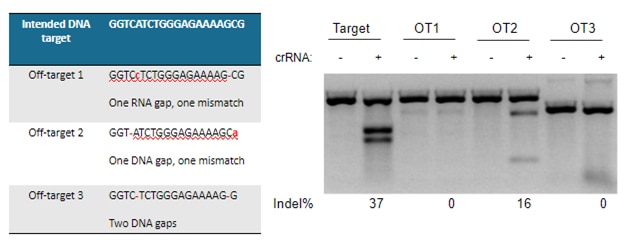
A demonstration of real-world off-targeting caused by a gap in alignment is shown in Figure 4, which also clearly displays that not every predicted off-target gRNA leads to a measurable effect.
The Edit-R proprietary design algorithm for guide RNAs (synthetic crRNA and lentiviral sgRNA) incorporates specificity analysis results to predesign easy-to-order reagents for high specificity and gene editing efficiency for human, mouse and rat model organisms. Just search for your gene and select from the available designs.
Order products
Cas9 nuclease
Configure the optimal promoter for your cell type to ensure robust Cas9 expression or explore DNA-free options
CRISPR controls and detection primers
CRISPR controls and detection primers
CRISPR guide RNA
High quality, ready-to-use lentiviral and synthetic reagents to guide Cas9 cleavage
CRISPR-Cas9 gene editing
Optimized tools for high-confidence genome engineering
Pooled sgRNA or arrayed crRNA
Pooled sgRNA or arrayed crRNA for high-throughput gene editing studies
Helpful resources
CRISPR-Cas9 gene editing with synthetic RNA - from start to finish
Read app note
A CRISPR-Cas9 gene engineering workflow: generating functional knockouts using Edit-R Cas9 and synthetic crRNA and tracrRNA
Watch video
Edit-R CRISPR-Cas9 gene engineering platform
