Next-generation sequencing (NGS), has become a universal tool in diverse industries; most recently moving into the clinic for patient diagnosis. However, if labs wish to analyze patient-derived materials they must first optimize and validate their workflow, which would include determining the exact test limitations.
It is due to the unequivocal interest and increasing popularity of NGS based tumor testing that specific guidelines for detecting tumor variants have been established, including by the State of New York Health Department1 advising on how to determine an assay's limit of detection to name but one parameter. Based on the recommendations, they state that samples should have enough sequence data for a minimum average coverage of 500x so that minor allele frequencies of 5% can be reliably detected. However, with newer technologies bestowing increasing importance on low allele frequencies and coverage bias issues (more below about this), should we be aspiring to push this limit of detection even further?
The increasing importance of the theoretical limit of detection
In order to enable disease discovery and diagnostics, it is imperative that NGS assays are validated for the detection of the lowest possible allelic frequencies. This is particularly true when thinking about the evolving trends and drive for greater accuracy in sequencing, including (but not limited to):
- The need for detection of cell-free DNA (cfDNA) at extremely low levels,
- Heterogenous tissue samples with large quantities of tumor-normal DNA,
- Non-invasive prenatal analysis and;
- To compensate for uneven coverage-distribution within samples (eg. GC rich).
Furthermore, the theoretical limit of detection for an NGS experiment is influenced by such parameters as molecular uniqueness (de-duplication), input amount and coverage (see figures below).
The effect of your choice of library preparation on its LOD
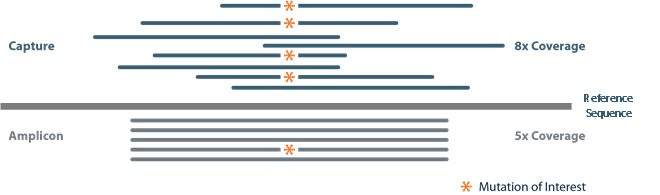
Amplicon-based
In a traditional amplicon panel, short amplicons are generated with the same forward and reverse primer sequences, targeting a specific region of interest (grey "reads" represented in the figure below). The identical ends of these sequences make it difficult to disambiguate unique molecules from those "duplicated" during PCR amplification. Ideally, only unique molecules would be used to calculate allele frequencies of mutations in order to avoid errors and bias from amplified DNA.
Capture-based
Conversely, capture-based libraries (navy blue "reads" in figure below) overcome this issue because the DNA is first randomly sheared, generating random start/stop sites that can be disambiguated or de-duplicated. However, the downside of capture-based libraries is that the input amount required is generally higher so may not be appropriate for hard-to-find/source tumors.
Regardless of the library method, determination of an assay's limit of detection using a known reference standard is general considered good practice.
Taking coverage bias into account
Importantly, because coverage distribution is not uniform across a sample, it may be necessary to sequence much deeper to achieve the desired coverage at each position of interest.
Sequencing coverage also plays a role in an assay's limit of detection. If you're not limited by input material, then the denominator of the equation below is not restricted by molecules but, rather, becomes reads exclusively:
Again, assuming four reads that contain the mutation of interest are required to detect allelic frequencies of 0.01% or lower, this positon must be sequenced at least 40,000. Importantly, since coverage distribution is not uniform across a sample, it may be necessary to sequence significantly deeper to achieve coverage of 40,000 at each position of interest. When experimental noise is factored in, the actual limit of detection may be much higher.

Conclusion
Pushing NGS to its theoretical limits is becoming increasingly important and it's imperative that the performance of protocols are evaluated with known standards before implementation into clinical workflows. In order to enable disease discovery and diagnostics, it is imperative that NGS assays are validated for the detection of the lowest possible allelic frequencies.
References
- New York State Department of Health. (2014, January). "Next Generation" Sequencing (NGS) guidelines for somatic genetic variant detection.