Tailor the sequencing of compounds and treatment times to best suit your epigenetic molecule
Epigenetic modifiers can be combined with chemotherapeutics or targeted agents to increase their efficacy. Horizon offers flexible high throughput combination screening designs to test epigenetic modifiers with hundreds of oncology focused standard-of-care drugs, emerging therapeutics and molecular probes. Examine the combination effects by priming cells with your pipeline molecule and then adding other oncology focused compounds.
The platform is also suitable for non-epigenetic molecules which require extended treatment times or multiple cell divisions to demonstrate their full phenotypic effect.
High Throughput Combination Screening for Epigenetic Modifiers
- Molecules of interest can be combined with hundreds of oncology focused standard-of-care drugs, emerging therapeutics and defined molecular probes
- Over 500 cell lines from 20 different cancer indications available for screening
- Customized treatment windows of greater than 7 days
- Two experimental designs available:
- Pre-treatment of the cells with your test article in flasks followed by addition of partner molecules in assay plates
- Sequential addition of your test article and partner molecules in assay plates
- Growth Inhibition measured by ATP levels
- Samples can be provided after the study for analysis of DNA methylation etc.
| You will receive |
|
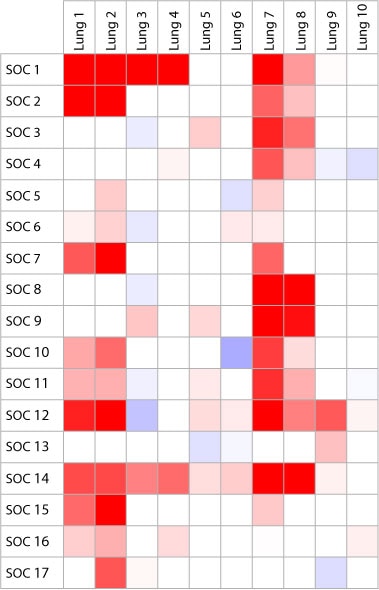
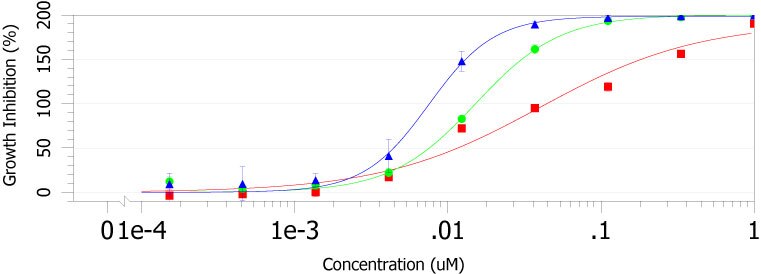
Heat Map and Dose Response Curves from High Throughput Combination Screening with Epigenetic Modifiers

Figure 1. Heat map showing global overview of results across multiple cell lines and conditions

Figure 2. Dose response curves demonstrating response area shifts of epigenetic study

